1.Why TPH calculations must never be sloppy?
To be honest, conveyor belts seem simple, but the most taboo is to “randomly” convey. TPH (tons per hour,TPH is used instead of tons per hour.) is the key number – it directly determines whether your conveyor belt is an efficient production machine or a “teammate-killing” equipment that will only drag down.
Without a good TPH, the days of the conveyor belt may become “Mission Impossible”. Imagine that when your belt is overloaded every day, the engine is running like a few bottles of energy drinks, and it will soon “collapse and lie flat”. A few more such “rollover scenes” may make your maintenance staff begin to doubt their career choices, and the finance department will start to “emo” because of those sudden maintenance bills.
Underestimating TPH is just as bad. This feeling is like buying a sports car but can only drive it at the speed of an electric car. The performance is not fully utilized, which is simply crazy. Especially when your boss stares at the production data and asks you why the conveyor belt looks great, but the amount of goods conveyed is as difficult as squeezing toothpaste, you are probably left with frustration and embarrassment.

Accurately calculating TPH is not only to prevent “accidental rollover”, but also to help you accurately design the conveying system. It can guide you to correctly choose the width and speed of the conveyor belt, as well as the configuration of the motor and tensioner, just like tailoring a perfect suit for the conveying system – fit, durable, and not waste money.
In addition, TPH calculation can also prevent you from over-investing and prevent you from spending a lot of money to buy a “super wide belt”, only to find that the actual production demand is like the traffic of motorcycles in the alley, and there is no need for such a wide “road” at all.
To put it bluntly, the accurate calculation of TPH is the first step for you to take the initiative in production. With it, you no longer have to run around in the trouble of belt blockage and equipment failure, but can truly realize the stable and efficient operation of the conveyor line, so that every penny is spent with peace of mind. Don’t be careless anymore and calculate the TPH of your delivery system carefully. This will definitely be one of the wisest decisions you make this year.
2.How to calculate the TPH of a conveyor belt? You must know these key parameters
When many people talk about TPH (tons of conveyed per hour), their first reaction is “speeding up”, but the actual situation is far more than that. TPH is a production capacity result of multiple factors. Behind it is a set of calculation logic closely related to the physical parameters of the conveyor belt. If you want the conveying system to run fast and stable, you have to start accurately from the following five core dimensions.
2.1 Belt speed (V) is the starting point and also a trap
The higher the belt speed, the more materials are transported per unit time. This is the most basic logic. But be aware that too high a belt speed will bring a series of side effects: serious material spillage, increased belt wear, soaring equipment noise, and even shortened conveyor belt life. To put it bluntly, if the increase in TPH is forced out by “stepping on the accelerator”, it is just overdrawing the life of your equipment.

2.2 Bandwidth (W) determines the “channel size” of the load
Wider belts can hold more, but the cost is also higher. Blindly widening is like building a six-lane highway in the countryside. It not only wastes resources, but also increases equipment weight, energy consumption and support structure requirements. Therefore, the design of bandwidth must be comprehensively matched with material characteristics and target TPH.

2.3 Material density (ρ) is the key to truly determine “tonnage”
The same “pile of materials”, if it is iron ore and wood chips, its actual weight may be very different. The unit of TPH is “ton”, not “cubic meter”, so it must be combined with material density calculation, and don’t treat light materials as heavy goods for transportation.

2.4 Cross-sectional area (A) cannot be guessed only by feeling
This is a very critical indicator that is ignored by many people. The so-called cross-sectional area refers to the effective cross-section occupied by material per unit length on the conveyor belt. Its size is affected by multiple factors such as bandwidth, groove angle, stacking angle, material state, etc. The larger the cross-sectional area, the more it can “load” per unit length.
If you don’t have drawings or detailed parameters, it is recommended to use empirical values for quick estimation:
Belt Width(mm) | Cross-sectional Area(m²) |
500 | ≈ 0.035 |
800 | ≈ 0.080 |
1000 | ≈ 0.110 |
1400 | ≈ 0.185 |
1800 | ≈ 0.280 |
But if you are in the design stage, it is recommended to use the following formula for precise calculation:
A = b₁ × h + (2/3) × h² × tan(α)
This formula takes into account factors such as the center flat section, the groove angles on both sides, and the height of the pile, and is suitable for trough conveyor belts.

2.5 Loading factor (η) determines how much power you have used
This factor reflects whether you are running at full load or “half empty”. It usually fluctuates between 0.6 and 0.9. Too low means wasting bandwidth, and too high means overloading. Setting a reasonable loading factor is the guarantee for stable operation of TPH.
A simple empirical formula helps you estimate TPH in seconds:
If you just want to quickly and roughly judge TPH, just remember this empirical formula:
TPH≈A×V×ρ×η
Don’t underestimate this simple formula, it has covered all the key variables we mentioned earlier: cross-sectional area, belt speed, material density and loading factor.

3.Common TPH Calculation Formulas
Let’s say you’ve got your belt speed, your belt width, and you know the material you’re hauling—great. Now comes the big question: how do you turn that data into something actually useful, like your TPH (tons per hour)?
Well, this is where formulas become your best friend—or your worst enemy if you mix up the units. Trust us, we’ve seen that spreadsheet horror story.
There’s no one-size-fits-all equation for TPH because units differ across regions and industries. But don’t worry. We’ll walk you through the most practical ones, tell you when to use each, and throw in some tips to keep you from falling into the “unit conversion trap.”
⚙️ Formula 1: The Imperial Approach (Used in the U.S.)
TPH = C × V × D × W ÷ 2000
- C= Load cross-sectional area (ft²)
- V= Belt speed (ft/min)
- D= Material density (lb/ft³)
- W= Load factor (0.6 to 0.9)
- ÷ 2000 converts pounds to tons
This formula is ideal if you’re working with feet and pounds. Just make sure all your inputs match. We’ve seen people accidentally use meters per second in this formula—and yes, the results were absurd.
⚙️ Formula 2: Metric System for Engineers
TPH = V × BW × ρ ÷ 1000
- V= Belt speed (m/s)
- BW= Belt width (m)
- ρ= Bulk density (kg/m³)
- ÷ 1000 converts kilograms to metric tons
This is the go-to formula if you’re dealing with metric systems and don’t have the cross-sectional area readily available. It assumes a moderately loaded belt and is especially useful for quick feasibility checks.
⚙️ Formula 3: Area-Based Approach
TPH = A × V × D ÷ 1000
- A= Cross-sectional area (m²)
- V= Belt speed (m/s)
- D= Density (kg/m³)
Use this when you already know—or have estimated—the area of material sitting on the belt per meter of length. It gives you a more tailored result, especially for non-standard belt setups or unusual material shapes.
3.1 Common Misjudgments in TPH Estimation
At higher levels of system design and optimization, the challenges in calculating TPH aren’t about basic arithmetic—they stem from strategic assumptions, input reliability, and contextual understanding of material behavior. Here are four commonly underestimated pitfalls that impact real-world TPH accuracy:
- Static vs. dynamic cross-section assumptions
Most TPH formulas use an idealized or static cross-sectional profile. But in reality, material loading fluctuates along the belt: feed point irregularities, vibration, and even belt sag can distort the cross-section dynamically. If your design assumes a perfect, consistent shape—especially at maximum load—you risk overestimating true throughput by 10–20%. Modern 3D scanning tools or CFD-based simulations can reveal how much cross-section instability you’re really working with. - Inadequate characterization of bulk material behavior
Material density isn’t fixed. Bulk solids behave differently under compaction, humidity, temperature shifts, or even grain shape variations. A TPH value based on dry lab samples may diverge sharply from what’s observed in field conditions—especially for hygroscopic or adhesive materials. It’s often more insightful to base calculations on operational bulk density, not theoretical catalog values. - Neglecting operational variability and real-world degradation
TPH design often assumes optimal conditions: a clean belt, calibrated feed, and stable motor speed. But factors like belt misalignment, pulley wear, or buildup at transfer points can reduce effective throughput significantly. Engineering for “ideal conditions” is a valid baseline—but robust systems include a degradation margin or dynamic monitoring feedback loop. - Excessive confidence in initial load factor settings
Many teams default to η = 0.85 or 0.9 based on historical templates, but rarely re-validate those numbers during production scaling. As system configurations change—especially with retrofits or new material sources—the actual load profile may shift subtly but significantly. If your load factor assumption lags behind operational changes, your TPH numbers may remain technically “correct,” but functionally misleading.
- Static vs. dynamic cross-section assumptions
3.2 Engineering Tip with Strategic Impact
When finalizing a TPH estimate, always test your model against at least one field measurement scenario—or simulate it using boundary conditions. Don’t just ask: “What’s the maximum this system can do?” Also ask: “What’s the worst-case consistent throughput we can guarantee under variance?” That’s the number your operations team will thank you for.
TPH formulas are more than math—they’re about translating your design into a working, efficient system. Pick the right one, feed it clean data, and you’ll unlock a clear picture of what your conveyor can really handle.

4.Step-by-Step Conveyor TPH Calculation
Let’s not sugarcoat it—this section might be the least exciting part of your day. We’re about to dig into formulas, variables, units, and that glorious world of “material handling math.” But stick with me. I’ll do my best to make it feel less like a dry engineering lecture and more like a slightly awkward but charming dinner party where everyone talks about conveyor belts. Ready? Let’s roll.
4.1 Collect the Ingredients
Before we cook up any TPH numbers, we need ingredients. Not flour and sugar—think:
- Belt speed (V)– meters per second (m/s) or feet per minute (fpm)
- Belt width (BW)– in meters or millimeters
- Material density (ρ)– kg/m³ or lb/ft³
- Load factor (η)– the percentage of how full your belt really is (not how full you wish it were)
- Cross-sectional area (A)– only if you’re feeling fancy
Just like a recipe, bad inputs = disappointing output. Get your real numbers, not assumptions. No one wants to base a design on “I think the belt goes kinda fast.”
4.2 Estimate Cross-Sectional Area (A)
This is where geometry shows up at the party. If you don’t already know your belt’s cross-sectional area, you can:
- Look it up in industry tables (yes, those still exist)
- Use a rough formula that blends rectangles, triangles, and the occasional trigonometric prayer:
A = b₁ × h + (2/3) × h² × tan(α)
Where:
- b₁ is the flat bottom width
- h is the heap height of the material
- α is the trough angle of the belt
If that makes your head spin, here’s a quick reference: an 800mm troughed belt usually gives you around 0.08 m² of cross-sectional area. Enough to impress your coworkers—or at least confuse them.
4.3 Pick Your Formula
Depending on what data you have, choose your formula like you’d choose a tool—don’t use a hammer when you need a screwdriver.
If you’ve got A (cross-sectional area):
TPH = A × V × ρ ÷ 1000
If you’ve got belt width but not area:
TPH = V × BW × ρ × η ÷ 1000
Both are valid. Just don’t mix them like a cocktail and expect something tasty.
4.4 Run the Numbers
Here comes the math. Let’s say:
- Belt speed = 2.5 m/s
- Belt width = 1.0 m
- Material density = 1,400 kg/m³
- Load factor = 0.85
- Cross-sectional area = 0.11 m²
Using area-based:
TPH = 0.11 × 2.5 × 1400 ÷ 1000 = 385 TPH
Using width + load factor:
TPH = 2.5 × 1.0 × 1400 × 0.85 ÷ 1000 = 297.5 TPH
See the difference? Area-based estimates are often more generous—sometimes a bit too generous. If you’re buying equipment based on that, your system might later ask for a raise (or just break down quietly).
4.5 Sanity-Check Your Result
Finally, apply some practical thinking:
- Does this number align with your plant’s capacity?
- Is it consistent with what your operators see every day?
- Could dust, incline, or inconsistent loading reduce it in practice?
If your calculated TPH is double what your belt has ever moved… congratulations, you just invented theoretical production.
That’s it—TPH, step by step, minus the snooze factor (hopefully). And if you survived this section without falling asleep or opening TikTok, you’re already ahead of most engineers by 10% efficiency.

5.Special Considerations for Bulk Materials
If you thought calculating TPH was as simple as plugging numbers into a formula—surprise! The bulk material itself is here to complicate things. Sand, gravel, coal, grain—they might all look like “stuff on a belt,” but in reality, they behave very differently when being moved. Welcome to the messy, unpredictable, but fascinating world of bulk solids.
This section is about the things that don’t show up in standard formulas but absolutely mess with your TPH if you ignore them. These are the real-world variables that even a perfect calculator can’t predict—but you, as a smart designer or operator, can anticipate.
📐 5.1 Heap Shape & Angle of Repose
Bulk materials don’t lie flat on a belt like a polite pancake. They heap. That “heap” is defined by the material’s angle of repose—the natural angle at which a pile of that material will stabilize without sliding.
A fine, dry sand might have a repose angle of 30°, forming a neat cone. Wet, sticky clay? Think of a lump that spreads sideways and climbs vertically. The steeper the angle, the higher your material can pile up—meaning more cross-sectional area, and potentially more TPH. But if the material doesn’t stack well, your theoretical cross-section will be full of air, not tons.
🌀 5.2 Flowability and Cohesiveness
If your material flows like sugar through a funnel, your life is good. But if it clumps like wet cement or sticks to the belt like peanut butter, welcome to bulk material hell.
Materials with low flowability can resist movement, leading to uneven loading, surges, or even complete blockages at the loading point. Cohesive materials often require belt scrapers, impact beds, and tighter troughing to behave. TPH may be reduced not because of speed or width, but because half the material just won’t move as expected.
🌧️ 5.3 Moisture Content
Moisture is one of the most insidious variables in bulk handling. A dry coal line might run beautifully at 600 TPH—but add 5% water, and suddenly it’s sticking to everything, reducing effective capacity and increasing drag. Some materials even change density significantly when wet, throwing off your previous TPH calculations entirely.
Always ask: What’s the worst-case moisture level this line will see? Design for that, not the “lab dry” spec.
🪨 5.4 Particle Size Distribution
It’s tempting to think of a material as just “rock” or “grain,” but particle size distribution plays a major role in behavior.
- Uniform sizes generally flow more predictably.
- Mixed sizes may compact more densely or create bridges and voids.
- Very fine particles can fluidize and shift unpredictably.
- Large, sharp particles may cause more wear and require tougher belt materials.
Even if your TPH calculation is perfect, inconsistent particle size can make loading erratic, causing you to “choke” the belt or underutilize capacity.
⛰️ 5.5 Conveyor Incline
Inclines change everything. As your conveyor tilts upward, the material starts fighting gravity. At certain angles (usually above 20° depending on material), you’ll need cleats, sidewalls, or flights to keep it in place.
Not accounting for incline correction factors can make your calculated TPH look great—on paper. But in practice, your material might be halfway back down the belt before it ever reaches the discharge point.
🔍 5.6 So What Should You Do?
Designers who treat bulk materials as mathematical constants usually end up with systems that work—until it rains, or the supplier changes quarry. To build a robust system:
- Always test materials in real conditions
- Use conservative load factors when in doubt
- Monitor loading behavior during startup
- Validate your assumptions with live performance data
Bulk materials aren’t out to ruin your TPH, but they will punish assumptions. Understand how your specific material behaves, and your conveyor system will be that much smarter, safer, and more reliable.

6.How to Choose Conveyor Belt Speed
When selecting or upgrading your conveyor system, choosing the right belt speed is critical—not just to meet throughput goals, but to keep your system running smoothly and economically. Let’s get straight to the point: this isn’t about faster always being better; it’s about understanding the practical realities behind conveyor speed.
Instead of overwhelming you with formulas (leave those headaches to us), let’s dive into why belt speed can cause certain problems—and what exactly happens behind the scenes.
6.1 Why High Belt Speeds Cause Problems
Running your conveyor belt faster seems like a straightforward way to increase production, but reality isn’t that simple. Here’s why high speeds create specific problems:
6.1.1 Material Spillage and Dust
When belt speeds exceed certain limits, materials don’t just sit calmly—they start bouncing and sliding. The reason is inertia: the faster the belt moves, the greater the force required to change the direction of the materials, especially at loading and discharge points. Result? More spillage over the sides and clouds of airborne dust.
6.1.2 Excessive Wear on Components
High belt speeds increase friction, particularly at rollers, pulleys, and skirtboards. Why? Because friction force increases exponentially with speed. Higher friction means components heat up faster, belts and rollers wear down quicker, and you see a steady increase in maintenance costs and downtime.
6.1.3 Increased Maintenance and Downtime
The harder and faster a belt runs, the quicker bearings and rollers degrade. Additionally, the impact of material bouncing at transfer points creates repeated stress on joints and seams, leading to cracks, rips, and premature belt failure. It’s like running your car engine at high RPMs constantly—sooner or later, something breaks.
6.2 Why Low Belt Speeds Can Also Hurt You
Now, slowing things down might sound safe—but overly slow conveyors create their own set of problems:
6.2.1 Reduced Efficiency and Lower Throughput
When a belt moves too slowly, the material piles up at loading points because it can’t clear quickly enough. The bottleneck is simple physics: slower belts mean fewer tons per hour. This directly impacts productivity, causing a chain reaction that slows down your entire production line.
6.2.2 Uneven Material Loading
At excessively slow speeds, materials don’t spread evenly across the belt surface. Why? The loading chute tends to drop material in dense piles that don’t naturally distribute themselves. This uneven distribution causes uneven wear on the belt surface and rollers, ultimately shortening component life.
6.2.3 Energy and Cost Inefficiency
Running a conveyor at very low speeds isn’t always energy-efficient, contrary to intuition. Conveyors have an optimal speed range where the motor’s torque matches the system load most efficiently. Go too slow, and you’re effectively paying for wasted potential, spending nearly the same energy costs without fully utilizing the belt’s designed capacity.
6.3 What Information Do We Need from You?
You don’t need to handle complex calculations. Just provide these critical inputs:
- Desired throughput (tons/hour)
- Material type (density and flow characteristics)
- Conveyor layout (flat, inclined, curved)
- Existing belt width and components (if applicable)
With this, we’ll precisely determine the belt speed that aligns your operational goals with practical realities.
6.4 A Real-World Example: Why Slowing Down Improved Productivity
Recently, a customer in Africa insisted on running their coal conveyor at high speed to maximize output. However, they experienced constant belt tracking problems, spillage, and rapidly deteriorating components.
Upon examining their setup, we identified the root cause: the high speed created uneven loading and excessive friction at transfer points. By reducing the speed by just 20%, the loading became smoother, and friction levels dropped. Maintenance demands fell dramatically, downtime decreased, and despite the lower speed, their actual daily production increased significantly due to fewer stoppages.
6.5 Why Leave the Belt Speed Calculations to Us?
Determining conveyor speed is more than plugging numbers into formulas; it requires a clear understanding of material dynamics, equipment behavior, and site-specific conditions. When you trust us with these calculations, you get:
- Precise throughput optimization
- Lower operating and maintenance costs
- Longer equipment life
- Reduced operational risk
6.6 The Bottom Line: Optimal Speed for Reliable Performance
In conveyor operations, the right belt speed is the one that consistently meets your production targets without causing excess wear or frequent downtime. Rather than guessing or oversimplifying, let us handle the details—providing you a solution built on real-world expertise, not theoretical ideals.
Choose correctly now, and you’ll enjoy predictable, trouble-free performance later. No more maintenance drama, no costly surprises—just reliable production, day after day.
Of course, if you need to verify your product, that’s fine. I’ve put the formula below, please use it yourself:
V = (TPH × 1000) / (A × ρ)

7.How to Use Conveyor Capacity Charts
Sometimes you don’t have time to run calculations, dig through specs, or wait for full simulations. You just want a fast answer to a simple question: Can this conveyor handle my required tons per hour?
That’s where conveyor capacity charts come in handy. They’re not perfect, but when used correctly, they offer a quick, reliable estimate—especially during the early planning stages or when speaking with clients who need an answer “right now.”
7.1 What Is a Capacity Chart?
A conveyor capacity chart shows the relationship between belt width, belt speed, and material capacity (TPH) for different material types or load conditions. It usually appears as a table where:
- Rows represent belt speed(in m/s or fpm)
- Columns represent belt width(in mm or inches)
- The intersecting cell gives you an estimated TPH
These values are based on typical load factors and cross-sectional area assumptions, usually under standard troughing angles and dry material conditions.
7.2 How to Use It
Let’s say your target is 500 TPH for dry aggregate. You find the 1000 mm column and move down until you find a speed that gives you 500 TPH—say, 2.4 m/s. That speed becomes your baseline. If your current system runs slower, you know it might need adjustment. If it’s already faster, you can check whether you’re operating efficiently—or risking wear.
It’s as simple as:
- Find your target TPH
- Locate your belt width
- Cross-match to see required speed range
7.3 When Are Charts Most Useful?
- Preliminary project sizing
- Quick checks in client discussions
- On-site troubleshooting
- Cross-verifying vendor claims
Remember: these charts are estimates, not final answers. Real results depend on material density, moisture, troughing, and incline. But if you need to know whether your system is in the right ballpark, capacity charts are a great starting point.
And if you’d like a custom chart based on your material and belt specs, we can generate one tailored to your exact needs—just ask.
Belt Width (mm) | Belt Speed 1.0 m/s | 1.5 m/s | 2.0 m/s | 2.5 m/s | 3.0 m/s |
500 | 131 | 197 | 262 | 328 | 393 |
650 | 200 | 300 | 400 | 500 | 600 |
800 | 280 | 420 | 560 | 700 | 840 |
1000 | 420 | 630 | 840 | 1050 | 1260 |
1200 | 600 | 900 | 1200 | 1500 | 1800 |
1400 | 825 | 1238 | 1650 | 2063 | 2475 |
1600 | 1080 | 1620 | 2160 | 2700 | 3240 |
1800 | 1360 | 2040 | 2720 | 3400 | 4080 |
2000 | 1650 | 2475 | 3300 | 4125 | 4950 |
8. Tools to Simplify Calculations
You know the theory behind conveyor belt TPH—but crunching numbers every time in spreadsheets can be tedious. Good news: there are tools designed to simplify that process. Depending on your stage—quick estimate or full system design—here’s what you should consider.
🧮 8.1 Excel Templates (Easy, Customizable)
A custom Excel template can be your go-to tool. Just input:
- Belt width (B), speed (V), material density (ρ)
- Cross-sectional area (A) or load factor (η)
Then let formulas run:
TPH = A × V × ρ ÷ 1000
or
TPH = V × B × ρ × η ÷ 1000
The advantage? You control it. Add your branding, fine-tune coefficients, and maintain transparency. It’s perfect for client consultations and quick quoting—without revealing proprietary secrets.
🌐 8.2 Free Online Calculators (Fast & Accessible)
When you need a ballpark number within seconds, try these:
8.2.1 Superior Industries’ Belt Capacity Calculator
- Covers belt width options (18–60 in), trough angles, density, and belt speed
- Suggests not exceeding 80% of design capacity for longevity
8.2.2 Superior’s ConveyCalc App (iOS)
- Includes belt capacity, horsepower, lift, and stockpile volume tools
These tools are ideal for on-site checks or rapid client replies—you just plug in your data, and get TPH instantly.
🧑💼 8.3 Professional Software: Belt Analyst (for Rigorous Design)
For full-scale engineering design, Belt Analyst by Overland Conveyor is the industry standard . It includes:
- Geometry setup (pulley positions, curves, inclines)
- Cross-sectional loading simulations
- Dynamic analysis (start/stop effects on tension and belt elongation)
- And a full capacity model linked to TPH output
Belt Analyst is available as Lite, Standard, Pro, or Suite—the Pro version starts at around USD 4,250 . A trial version is available, so you can test it before committing.
🔧 8.4 How to Choose the Right Tool
Stage | Tool | Why Use It |
Preliminary planning | Online calculators | Fast in-field estimates; no setup needed |
Quoting & proposals | Excel template | Branded, transparent, flexible |
Final design & build | Belt Analyst | Accurate modeling, all critical system factors |
8.5 Key Takeaway
You don’t have to reinvent the wheel—or the calculator. Use:
- Excel templates for quick, customizable reports
- Superior’s free online tools for fast, on-the-spot estimates
- Belt Analyst when your system demands precision, reliability, and engineering assurance
Each tool supports your needs at different stages—so your conveyor TPH targets are just a few clicks away. Whenever you’re ready for templates, links, or consultation, I’m here to help!

9.How TPH Drives Every Design Decision
You’ve decided on a target tonnage—great! But did you know that TPH isn’t just a number? It’s the glue that holds together belt selection, motor sizing, component layout—you name it. Ignore it, and your “great deal” could turn into a messy juggling act with rattling belts, overworked motors, and shop-floor headaches.
▶️ 9.1 Choosing the Right Belt Construction
Whether it’s EP630, EP100 or EP200, the choice comes down to mechanical stress and wallet stress. Higher TPH usually means heavier or more abrasive material. For instance, carrying 800 TPH of limestone? You’re flirting with belt abrasion and edge tearing. So we recommend a stronger belt with abrasion-resistant cover—not to push up price, but to avoid premature failure. Imagine your plant grinding to a halt because the belt shredded? Us neither.
⚙️ 9.2 Motor Power Is About More Than Weight
Plot twist: it’s rarely just “belt weight × speed.” If you start the belt full of material, lift it uphill, or fight friction in curves, you’ll want a motor with enough torque cushion—especially for start/stop cycles. Without it, what seems like a functional setup can stall at kickoff, or worse—burn out. We size motors so they run at about 70–85% load in normal operation, leaving overhead for startup events and wear—eliminating the “why did it die on Day 1?” scenario.
🎡 9.3 Idler and Roller Configuration: Not an Afterthought
For high TPH, spacing between idlers isn’t just about cost—it directly impacts belt tension, sag, and tracking. Think of these rollers as your belt’s backbone. Get them wrong, and the belt droops at the center, creating drag, power loss, and a dirt trap under the trough. We calculate roller spacing based on material bulk density, TPH, and belt width—so every roller earns its place and supports load evenly.
🔄 9.4 Transfer Point Design: Reduce Shock and Dust
Imagine mining-grade ore falling from a 1 m height onto a fast-moving belt. Without proper design, it hits hard—sending dust clouds sky high and putting strain on the belt knuckle. High TPH means more frequent drops. That’s why we design impact beds, angled transition chutes, and smooth skirtboards to absorb blow, guide material, and minimize dust—all tailored to your specific throughput.
📏 9.5 Pulley Size and Belt Tension: A Balancing Act
Your belt acts like a stretched rubber band holding material in place. Too much tension? Belt is under constant strain, driving energy costs and wear. Too little? It wanders, causes edge wear, and leads to spillage. We calculate ideal tension—based on TPH, belt cover stiffness, and pulley diameter—then complement it with tensioning systems that keep things on track under load.
🌧 9.6 Accounting for Environmental Stressors
High TPH setups don’t exist in a vacuum. Add moisture, dust, incline, or heat, and the rules shift. A belt carrying 900 TPH of dry sand behaves very differently when that sand holds 5% moisture and you’re in a 12 °C/50 °F environment. Suddenly, cohesion kicks in, friction goes up, and material sticks. So we adjust roller spacing, tension specs, scraper systems, and enclosure needs to handle your specific conditions—before things get sticky.
🔄 9.7 Planning for Maintenance: Design to Last
Systems built to max TPH specs often run flawlessly for six months—until they don’t. Anticipating wear, we over-engineer key modules just enough: tension that can adjust, access points for rollers, and cartridges that pop out easily. By designing with maintenance in mind, we remove surprises—and that keeps your line running steadily longer than you’d expect from a “budget spec” solution.
10.How to Choose the Right Conveyor Based on TPH
Here’s your 6-step guide in a nutshell:
1.Pick the right Rubber conveyor belt width and speed
2.Match belt type to your specific material
3.Size the motor and drive system correctly
4.Select the ideal trough structure
5.Factor in dust control and safety
6.Design for future scalability
Let’s unpack each step so you can understand why it matters—and how it makes your life easier.
10.1 Belt Width & Speed: The Heart of Capacity
Your TPH target depends directly on belt width and speed. For instance, under 500 TPH? A 650 mm belt at 2–3 m/s often does the job. But if you need over 1,000 TPH, you’re likely looking at 1,200 mm+ belts—or multiple lines. Use this formula:
TPH = A × V × ρ ÷ 1000
Here, A is cross-sectional area, V is belt speed, and ρ is material density. Play with these until you hit your TPH. Easy to tweak, even in early discussions.
10.2 Belt Type: Don’t Trust Looks—Trust Specs
Your material might be soft sand or abrasive stone—it matters. Carrying 600 TPH of wet sand is nothing like moving 600 TPH of dry, abrasive rock. You’ll need specialized belts like ST1250 with abrasion-resistant covers. Choosing the right belt early prevents shredding and maintenance chaos down the line—no more emergency orders or weekend panic.
10.3 Motor and Drive: More than Just Power
You don’t just need a motor that’s powerful—you need one that runs most efficiently at your operating point. Ideally, motors operate at 70–85% load, not pushing 100% or languishing at 30%. Oversized motors waste money; undersized ones stall or burn out. We size motors accounting for lift, friction, and startup torque so they’re neither lazy nor stressed—just consistent and dependable.
10.4 Trough and Structure: Hold Everything in Place
The trough angle (20° vs. 35°) affects how much material the belt can hold. A 20° trough might be OK for light materials up to 800 TPH, but bulkier, wetter or rough materials—especially over 1,000 TPH—need steeper angles and stronger support structures. The wrong trough design equals spillage, belt edge issues, and roller fatigue. That’s why we adjust framing and roller specs for your target TPH.
10.5 Dust Control & Safety: It’s Not Optional
High TPH = more dust, higher risk, and tougher regulatory scrutiny. That means adding:
- Skirt boards & belt cleaners to capture stray material
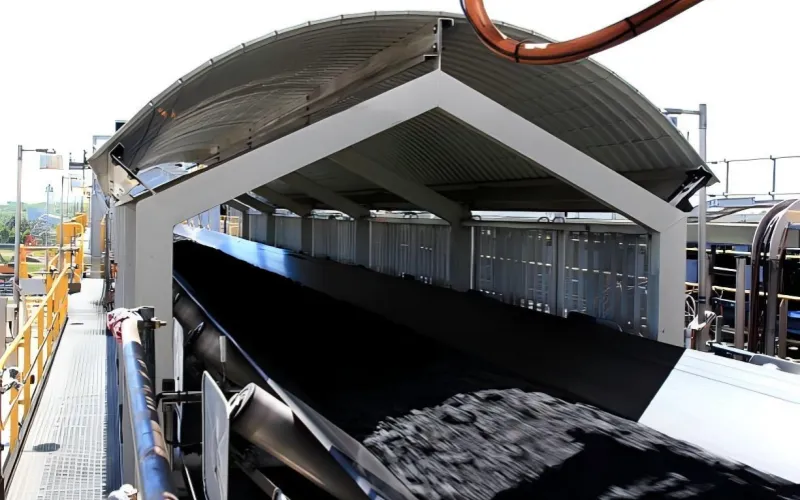
- Enclosures or covers to contain dust
- Chutes and impact beds to manage flow
- Safety rails and emergency stops to comply with standards
These features aren’t extra—they’re essential. You get improved air quality, fewer fines, and a safer environment, even when system capacity ramps up.
10.6 Scalability & Maintenance: Design with the Future In Mind
Maybe you start with 700 TPH, but next year you’re pushing 1,200. A system designed around future capacity means:
- Idlers, belts, and motors already sized for that growth
- Easy-access access points for quick part replacement
- Envelope allowances for extra rollers, tensions, or controls
This approach costs a bit more up front, but saves exponentially by avoiding pricey retrofits or full equipment replacement later. Your line stays ahead of demand, not trailing behind.
10.7 Example: A 700 TPH Wet Sand Conveyor
- Step 1: Choose 1,200 mm belt at ~3.5 m/s (instead of running a narrower belt at a risky fast speed)
- Step 2: Specify ST1250 belt with water-resistant cover
- Step 3: Select motor sized to run at ~80% load under normal conditions, with plenty of torque for startup and incline
- Step 4: Use a 35° trough setting with reinforced structure and idler spacing optimized for 700 TPH
- Step 5: Add belt cleaner, skirt-boards, covered transfer chutes, and dust suppression
- Step 6: Include a modular tension system and layout that can support 1,200 TPH in the future
Now you’re not guessing—you’ve built a conveyor that consistently moves 700 TPH with room to grow—no belt shredding, no motor stalls, no hidden downtime.

11.When to Recalculate Your TPH
Recalculating your TPH isn’t something you do just for fun—it’s what smart operators do when things feel off. Maybe your belt’s running fine, but production is lagging. Or maybe your maintenance guy mutters, “This thing wasn’t built for this load.” That’s your cue. TPH isn’t static—it lives, breathes, and reacts to change.
🔄 11.1 You Switched Materials
Your conveyor was happy carrying 600 TPH of dry limestone. Now it’s loaded with wet clay. That’s a density jump and a material behavior twist. The belt might be the same, but the numbers? Completely different.
Update your formula:
TPH = A × V × ρ ÷ 1000
If ρ changes, your entire capacity shifts. Ignore that, and you’ll either underload (wasting energy) or overload (wearing down belts faster than bad jokes at a company party).
🔧11.2 You Upgraded Components
Swapped out the belt for something tougher? Great. But that belt might be thicker and stiffer, reducing the trough depth. Or maybe you replaced the motor—nice, but did you adjust the tension system to account for torque and belt stretch under higher loads?
Even adding a new idler frame can change your loading profile. Everything affects everything else.
🧪 11.3 Performance Is Slipping
If your plant output is down but all systems seem “normal,” your actual TPH may be drifting. Wear and tear on rollers, sagging belts, or uneven loading can drag down throughput. What used to be 500 TPH is now 430, and no one noticed until someone checked the weighbridge.
📈 11.4 You’re Expanding
Going from 400 TPH to 800 sounds straightforward—until your belt starts flapping and your motor wheezes. Scaling up production means checking if your design envelope still fits. Double the TPH doesn’t always mean double the speed or width—sometimes you need a whole new strategy.
📋 11.5 New Supplier, New Specs
A new belt vendor says their 1000 mm belt is “standard.” But their fabric layer, cover rubber, and tensile rating differ. It runs differently, loads differently, and may throw your old TPH math out the window.

12.Frequently Asked Questions (FAQ)
Q1: My system is overloaded even though the belt width and speed meet design specs. What could be wrong?
A1: Meeting theoretical belt width and speed doesn’t guarantee actual capacity if other factors are misaligned. Common causes include:
- Incorrect loading chute geometry, leading to off-center loading and reduced trough fill
- Excessive material bounce or rollback, especially on inclines or with cohesive materials
- Poorly maintained idlers or rollers, increasing drag and belt sag, reducing effective carrying area
- Improper tensioning, which can affect belt tracking and material stability
The solution is not necessarily to widen the belt or speed it up. Instead:
- Audit your loading point for symmetry, flow control, and drop height
- Verify idler spacing and alignment
- Use a load scanner or belt scale to check actual versus theoretical throughput
- Apply corrective measures like center guides, belt scrapers, or controlled-feed chutes
When theory meets real-world variables, field validation becomes essential.
Q2: My conveyor is inclined. Can I still use the standard TPH formulas?
A2: No, not directly. Inclined conveyors experience reduced capacity due to gravity resisting material flow. You must apply an inclination correction factor (typically 0.85–0.95 for inclines between 10° and 20°). Additionally, spillage risk increases at higher inclines, requiring better containment and possibly a lower belt speed. Use tools like Belt Analyst for accurate modeling.
Q3: Is there a rule-of-thumb for quick TPH estimation?
A3: Yes. For standard 3-roll troughed belts at 20°–35°:
- TPH ≈ (B × V × η × ρ) ÷ 1000
Where:
- B = belt width (m)
- V = speed (m/s)
- η = load factor (0.6–0.9)
- ρ = material bulk density (kg/m³)
This method gives a rough estimate but is not a substitute for precise design. Use only during initial discussions or feasibility checks.
Q4: Same belt width and speed, but Site A handles more than Site B. Why?
A4: Variability could come from:
- Different load factors(η) due to hopper design or operator behavior
- Inconsistent material flow(e.g. wet vs. dry)
- Uneven belt loading at transfer points
- Differences in idler spacing, causing belt sag and reduced capacity
Conduct a full operational audit. Analyze loading, chute design, belt alignment, and idler maintenance status.
Q5: We replaced our motor with a higher RPM model—now material spills more often. Why?
A5: A higher RPM motor increases belt speed, which can lead to several cascading issues:
- Reduced load stability: Faster belts can cause material to shift or bounce, especially near loading points.
- Increased spillage: Higher speed reduces the time material has to settle into the trough, leading to overflow at transition areas.
- Mismatch with trough geometry: At higher speeds, standard 20°–35° troughing may no longer confine material effectively.
- Undersized skirt boards and chutes: These may have been designed for the original speed and are now insufficient.
To correct the issue:
- Verify if the new speed exceeds the design limit for your material type and belt width
- Consider lowering RPM using a gearbox or VFD
- Modify loading chutes to provide smoother entry at higher velocities
- Upgrade skirt boards or install material control devices
Always assess the full mechanical system before changing motor specs—power is nothing without control.


