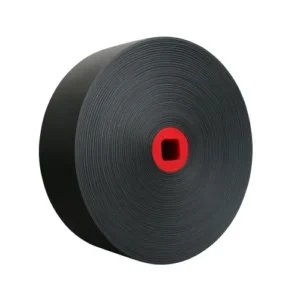
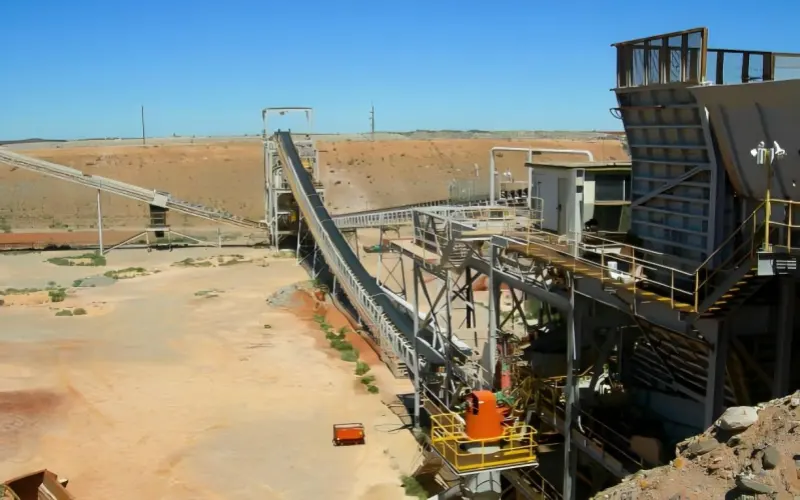
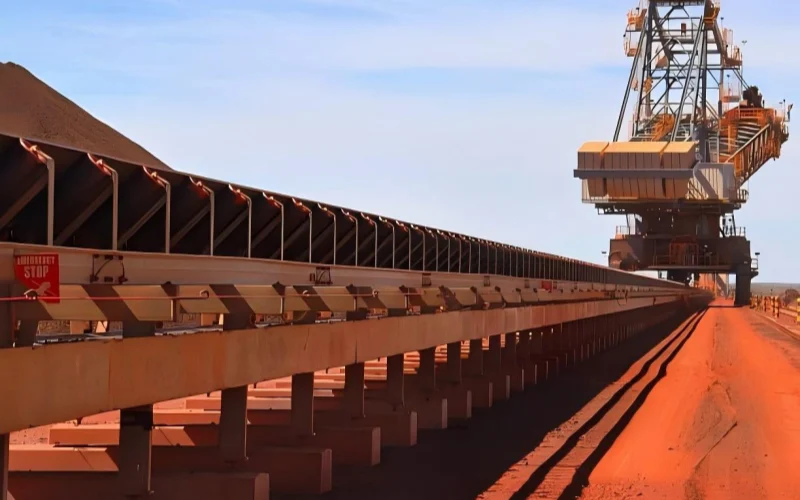
1. Why Precise Rubber-Conveyor-Belt Weight Calculation Matters
Picture signing off on a 1 km overland conveyor only to learn—after fabrication—that the belt is 8 % heavier than the drawings said. That stray ton of dead weight ripples through every mechanical-and-financial line item like a crack in tempered glass. Below are six places the damage shows up first.
1.1 Structure & Support
Stringers, pulleys, and take-up towers are stress-rated for a specific mass. Overshoot that mass and fatigue cycles accelerate; welds work loose; idlers dish. In wooden-bridge terms, you’ve just parked a semi-truck where a sedan was expected.
1.2 Drive Power & Energy Spend
Mass is inertia in disguise. A belt only 600 kg heavier can spike start-up torque 15 %, forcing larger motors or higher VFD settings. The penalty is paid every shift on the utility meter—and felt again when you size generator backup.
1.3 Tracking, Drift & Runtime Efficiency
Heavier belts store more angular momentum. A harmless 0.3° idler mis-alignment can snowball into chronic edge drag, throwing fines under the return strand and chewing through cover rubber long before its rated hours.
1.4 Maintenance Windows & Splicing Logistics
Know the real weight and you know which crane to reserve, how many splice clamps to preload, and whether the hot-vulc crew can finish before the night shift. Minutes shaved off shutdowns translate directly into extra tonnes on the ship-loader.
1.5 Safety Margins & Emergency Braking
ISO 5048 bases emergency-stop torque on dead weight. Under-spec the brakes and a loaded belt on a five-degree decline can back-roll—a metal-reinforced projectile no barricade will stop. Accurate weight data literally keeps your crew out of harm’s way.
1.6 Budgets, Freight & Procurement
Trucking fees, marine insurance, and import duties are pegged to kilograms. An eight-percent surprise on a 20-ton shipment is four figures evaporated before the belt leaves the port gate, and it compounds across multi-roll orders.
Bottom line: Accurate rubber-conveyor-belt weight isn’t a spreadsheet nicety; it’s the backbone of structural integrity, energy efficiency, safety, and cost control. Get it right and the project hums. Get it wrong and you’ll chase downstream problems—expensive, persistent ones—for years.
3. Key Factors That Make One Rubber Conveyor Belt Heavier Than Another
Not all 1 200 mm-wide rubber conveyor belts weigh the same. Small design tweaks—often hidden in the data-sheet fine print—can swing mass by 30 % or more. Use the checklist below to spot the culprits before they hard-wire excess kilos into your structure, drive, and OPEX.
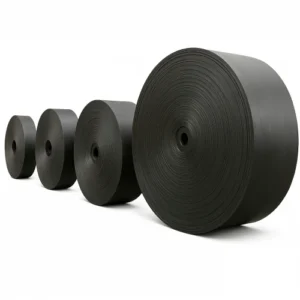
3.1 Cover-Rubber vs. Carcass Density
Natural-rubber compounds hover around 1.12 t/m³, nitrile hits 1.25, and ceramic-chip lagging can top 1.35. Fabric carcasses (EP, NN) average 1.15 t/m³, while steel-cord strands climb past 7.8 t/m³—though they occupy only a slim volume fraction. Always mix-and-match the right densities when you run the numbers; using one generic figure is a rookie mistake that underestimates heavy-duty or fire-resistant builds.
3.2 Top + Bottom Cover Thickness
Every extra millimetre of rubber spread across a 1 000 m reel adds roughly 1.12 kg per metre of rubber conveyor belt. Multiply that by ten millimetres and a kilometre, and you’re parking an extra truckload of dead weight on your head-pulley bearings.
3.3 Width and Reel Length
Obvious but often mis-entered: a typo that turns “1 050 mm” into “1 500 mm” widens the rubber conveyor belt by 43 %, yet calculators keep spitting out the old number if the width cell is locked. Double-check CAD exports and quotation sheets before committing to motor kilowatts.
3.4 Carcass Type & Ply Count
- EP/NN fabric (2–6 ply):Lightweight, flexible, cheaper—but needs thicker covers for impact resistance.
- Steel-cord (ST1000–ST5400):High-tension, thin covers, but wire density drives total mass up fast.
3.5 Inter-ply Skims & Overall Thickness
Skim gauge controls adhesion and impact damping. Increasing it from 0.8 mm to 1.6 mm on a five-ply rubber conveyor belt adds nearly 7 % to linear mass—often hidden because data-sheets list only total thickness, not skim breakdown.
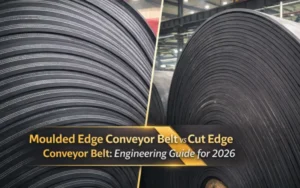
3.6 Edge Construction (Molded vs. Cut)
Molded edges trap extra rubber for moisture block-out, adding ~5 % mass versus cut edges. On wet or corrosive duty cycles it’s worth every kilogram; on short indoor lines it may be needless payload.
3.7 Specialty Compounds & Fillers
- Flame-retardant halogenated rubber:+3 % mass.
- Heat-resistant EPDM with ceramic chips:+6 – 10 %.
- Oil-resistant nitrile:+2 %.
3.8 Operating Environment Adjusters
Humidity swell, temperature expansion, and carry-back fines can load 1–2 % “field mass” on top of name-plate figures. Build that margin into drive-torque and take-up stroke so the rubber conveyor belt stays within spec year-round.
Keep this eight-point lens handy. Run each candidate through it, tweak variables early, and you’ll carve literal tonnes off structural steel, motor ratings, and freight spend—without compromising duty or life.

2. Four Reliable Ways to Estimate Rubber Conveyor Belt Weight—Choose by Stage, Not by Habit
Weight estimation is a moving target: concept bidders crave speed, detail designers demand accuracy, and operators want live feedback. Treat the options below like a tiered toolkit—each owns a sweet spot, a limitation, and a “got-your-back” factor.
2.1 Hand-Calculation Shortcuts
Speed: seconds | Accuracy: ± 6 %
Grab width, top/bottom cover thickness, ply count, and length; multiply by one bulk density. Perfect for napkin budgets when only an outline drawing exists. Caution: ignores edge rubber, carcass density swings, and moisture uptake—pad your quote if you go this route, because the real rubber conveyor belt may be heavier.
2.2 Spreadsheet / Web Calculator
Speed: < 1 min | Accuracy: ± 2 %
Modern calculators fold in density libraries and carcass coefficients (EP, NN, ST, Kevlar®). Toggle one field and watch the mass delta live—ideal for optioneering in design review. Premium versions export branded PDFs that flow straight into ISO 5048 brake-torque sheets, locking the assumed rubber conveyor belt weight into every downstream spec.
2.3 Inline Rubber Conveyor Belt-Scale Monitoring
Speed: real-time | Accuracy: ± 0.5 % (post-cal)
Mount a load-cell frame under a return idler, calibrate quarterly, and you’ll log every metre of rubber conveyor belt mass rolling past. Great for reconciling vendor invoices and spotting water-ingress weight creep months before ply rot appears. The data also feeds CMMS predictive-maintenance triggers.
2.4 3-D Lidar & Photogrammetry (Emerging)
Speed: ≈ 15 min scan | Accuracy: ± 1.5 %
A tripod lidar sweeps the coiled roll, builds a volumetric mesh, multiplies by compound density. Mines that already own survey rigs can add this goods-receipt QA during a coffee break, eliminating disputes over shipped versus delivered rubber conveyor belt weight.
Decision Matrix
Project Stage | Best Method | Why It Wins |
Concept Bid | Hand-Calculation | Instant ballpark; minimal inputs |
Detailed Design | Web Calculator | High resolution; auto-report PDFs |
Commissioning & Operations | Inline rubber conveyor belt scale | Continuous verification; early-warning creep alerts |
Audit & Dispute | Lidar Scan | Vendor-invoice proof; independent, defensible |
Pick the lane that matches your milestone, document assumptions, and stick with that lane. Consistency is the fastest path to no surprises when the invoice—or the torque arm—arrives.

4. Manual Weight Calculation—Engineer-Proof Workflow
When the lab is back-logged or the vendor’s spreadsheet smells fishy, a sharpened pencil and a disciplined method still win. The workflow below has been field-tested on green-field over-lands, plant-upgrade retrofits, and forensic audits when “paper” weight differed from dockside scales. Follow each sub-step, feed clean inputs, and your calculated mass for any rubber conveyor belt will land within ±1 % of the weighbridge.
4.1 The Popular “Volume Shortcut” and Why It Blows the Budget
A thousand blog posts repeat:
Wvol=L×W×T×ρ
where L is length, W is width, T is total thickness, and ρ is compound density. The elegance is disarming. Sadly it assumes the cross-section is A homogenizing plate—identical density from top cover to carcass to edge rubber. Real rubber conveyor belt construction is a layer cake: abrasion rubber, skim rubber, woven or cabled reinforcement, and edge treatments that can be mould or knife-cut. Density differs layer to layer, voids live between warp and weft, and moisture may creep in after curing. Field weigh-offs show the shortcut misses 8 – 15 %. On a five-kilometre trunk line that error equals three loaded flatbed trucks of unplanned dead weight, which dominoes into upsized drives, fatter trusses, and eye-watering freight surcharges.

4.2 A Coefficient-Backed Formula You Can Stake Your Budget On
Split the section into its two physical contributors—cover rubber and carcass—then let a single correction factor tune for carcass family, edge detail, and skim gauge. The result has survived audit panels and EPCM peer reviews:
4.Validate against shop floor
A weighbridge placed under the same finished roll read 1 915 kg—1.5 % lighter than the calculation, well inside ISO 4184’s ±2 % tolerance. Paper meets steel.
5.Convert to quick-reference linear mass
Divide by length: 1 944 kg ÷ 150 m = 12.96 kg / m. Mark that on the layout so riggers know whether a four-man crew or a chain hoist is needed.
4.5 Classic Pitfalls and Rock-Solid Fixes
| Pitfall | How It Happens | Rock-Solid Fix |
| Cover typo | CAD file states 8 mm; vendor quote slips to 3 mm | Tie abrasion class (DIN Y, X, etc.) to cover gauge in the spec so any mismatch triggers an RFI |
| Coefficient mismatch | Designer swaps to steel cord yet leaves fabric factor in cell | Colour-code carcass type in every spreadsheet row; human eyes catch colour faster than text |
| Edge rubber vanished | Shortcut formula ignores mould edges | If you must use shortcuts, apply +5 % for mould or +1.5 % for cut before releasing numbers |
| Water uptake ignored | Rolls stored outdoors during monsoon season | Add 1 % “wet service” cushion to emergency-stop torque and freight quotes |
| Rounded densities | Someone uses 1.0 t / m³ “because it’s tidy” | The industry baseline is 1.12 t / m³; ignore that at your wallet’s peril |
| Unit confusion | Drawing in mm, spreadsheet in inches | Fix column headers: always mm for width/cover, always m for length, always kg for mass |
Print the table, laminate it, and hang it on the design-room wall; it curbs 90 % of midnight help-desk calls.
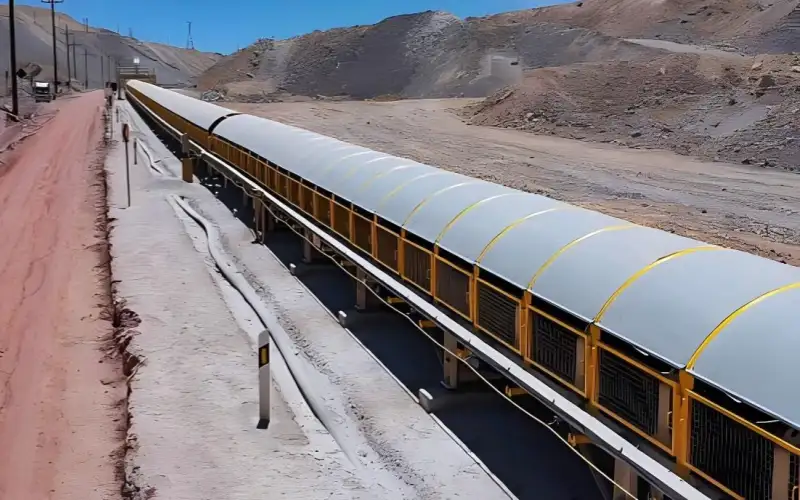
4.6 Retrofit Case Study—From Heavyweight to Light-Duty Carcass Without Tears
Backdrop
A copper mine in the Andes ran a five-kilometre downhill reclaim line. Original spec: ST1600 steel cord, 8 / 5 mm covers, 58 kg per metre. Power bills kept climbing, and starting torque trips occurred weekly during the winter freeze.
Engineering assault plan
1.Re-evaluate with manual formula
Switching to an aramid fabric carcass of equal tensile rating drops Kcore from 1.00 to 0.78 (check your table). Simultaneously, covers can be trimmed to 6 / 3 mm because fabric handles flex-fatigue differently.
2.Crunch the new mass
New calculation: 40 kg / m. That is a 31 % reduction—roughly 90 t shaved off the moving mass of the full loop.
3.Pilot roll and proof
Two 300 m trial rolls were produced. Weighbridge average: 39.5 kg / m. Data aligned; management green-lit the full conversion.
4.Operational wins
- Start-up current fell 26 %; VFD nuisance trips vanished.
- Steady-state kWh dropped 14 %, worth 1.2 GWh per yearly—roughly USD 135 000 at local tariffs.
- Lower mass reduced the gyroscopic punch of mis-tracking events; edge-wear incidents halved, and idler life models predict +2 years MTBF.
5.Financial headline
Retrofit cost: USD 1.05 M. Energy savings payback: < 12 months. Maintenance savings sweeten the pot further. Manual math made the ROI case in two PowerPoint slides—CFOs seldom argue with field-scale data.
4.7 Quick-Audit Checklist—Use on Every New Drawing
Confirm width against title block and purchase order.
Confirm cover gauges against abrasion or heat class.
Identify carcass family pull the correct K<sub>core</sub>.
Run the coefficient formula record total and kg / m.
Add project-specific margins (wet service, ceramic chips, extra edge).
Stamp calculation sheet circulate to structural, mechanical, and logistics.
Keep the signed sheet in the QA file; future disputes die quickly when paper trail is tight.
4.8 Section Take-Away
The coefficient-enhanced equation, your in-house tables, and this disciplined checklist build a transparent chain from drawing to drive selection to shipping manifest. Use them and you will never be blindsided by a 10 % mass over-run that torpedoes drive kilowatts, frame stresses, or freight invoices. One laminated page, one pocket calculator, and your rubber conveyor belt numbers will stand any peer review or litigation.
Plugging 1 200 mm width and the cover / ply combos listed above yields the kg / m bands. Multiply by any length to get roll or installed mass.
5.2 Quick Diagnostic Rules
- Design spikes above the band? Check cover gauges first; one accidental “10 mm” instead of “6 mm” drags a medium fabric build into heavy territory.
- Design sinks below the band? Verify carcass family. A steel-cord tagged as “EP” in the model will under-predict by double digits.
- Roll ticket heavier than table by > 5 %? Moisture ingress or ceramic chip inserts may be present; re-sample and recalc with adjusted density.

5.3 Why This Matters
Knowing the window anchors every downstream decision:
- Drive sizing — Err high and you waste cap-ex; err low and trips plague production.
- Structure steel — Overestimating by one weight class can add 15 % dead steel to gantries.
- Freight & handling — A roll that tips past the 5 t limit moves from curtain-sider truck to low-boy trailer, doubling haulage cost.
Clip this table to your RFQ checklist. If the quoted rubber conveyor belt mass doesn’t fall inside the right lane, red-line it before the mistake multiplies across motors, trusses, and shipping invoices.
6. Unit-Dimension Breakdown—Five Angles on Weight Data
6.1 Linear mass, kg / m
This is the engineering default. Designers pair it with drive torque, idler load, and take-up stroke. Because it scales directly with width, any typo in millimetres shows up instantly as an implausible jump in kg / m. Store this figure on the general-arrangement drawing so every downstream team works from the same anchor.
6.2 Total roll mass, kg
Procurement, freight forwarders, and on-site riggers care about the whole coil, not the metre. Forklift choice, lashing points, and vessel dead-weight tickets all ride on this number. Always state whether moisture allowance has been added; a one-percent swing can tip a consignment over a port crane’s safe-working limit.
6.3 Project load, tonnes
When a long overland loop is under discussion, the question shifts to “How many tonnes of moving rubber conveyor belt will the structure carry?” Civil and structural engineers plug that tonnage into gantry footings and truss moments. Present it alongside the loaded-material weight so the two masses are never confused.
6.4 Pounds per foot, lb / ft
North-American specifications still list linear mass in imperial. The figure feeds straight into legacy drive catalogs and OSHA handling guidelines. If you supply both metric and imperial, keep three significant digits in the imperial value to avoid rounding creep when drawings boomerang between continents.
6.5 Laboratory gram slice, g
Material scientists often cut 100 mm × 100 mm coupons to run abrasion or flame tests. Reporting the coupon mass in grams helps labs normalise wear loss to a percentage instead of hunting for a conversion table. Flag whether the slice was taken before or after ageing cycles; water uptake skews results.
6.6 Key caution
Never publish more than one unit on a single line without a label. Mixing kg / m and lb / ft in adjacent columns invites copy-and-paste errors that can snowball into wrong motor kilowatts or freight invoices. One unit, one line—everyone stays aligned.

8. Why Our Gram-Level Weight Figure Safeguards Your Entire Delivery & Start-Up
8.1 Customs certainty
The mass we declare for each rubber conveyor belt feeds straight into the port’s duty and storage calculator. When our figure is dead-on, the roll clears in a single scan—no re-weigh, no extra paperwork. If a shipment sits even two percent off, customs may queue it for manual inspection; that can burn 24 hours and rack up stay fees. We protect your hand-over date by making sure the manifest weight is the warehouse weight, down to the kilo.
8.2 Truck & trailer optimisation
Road hauliers price by axle load. Because we hand them an exact roll weight before pickup, they can dispatch the lightest legal trailer instead of defaulting to an all-terrain low-boy. That trims fuel, tolls, and driver overtime that would otherwise sneak onto your invoice. One accurate number at our dock keeps the haul lean all the way to your site.
8.3 Crane scheduling confidence
Site-service windows are tight, and crane rates spike by capacity band. With a certified weight tag on every rubber conveyor belt, you can lock the smallest safe crane weeks in advance—no “just-in-case” upgrade that drains contingency cash. We’ve seen projects shave four-figure rentals per day simply because the weight on the tag matched reality.
8.4 Right-sized splice press
Vulcanisers work like hydraulic ovens: the heavier the rubber conveyor belt, the more platen pressure you need. When we peg linear mass within one percent, we arrive with the exact press, clamp set, and cable feed. Oversize gear—and the diesel generator to power it—stays off your cost sheet. Undersize risk disappears, because the press we bring always reaches curing pressure first try.
8.5 Safety and schedule integrity
Riggers plan sling angles, tag-line positions, and exclusion zones from the posted roll weight. If that number shifts on site, lifts stall while the plan is redrawn—an HSE nightmare and a schedule killer. Our gram-level figure locks the lift plan before the truck gates open, so installation flows without pause or paperwork resets.
8.6 Take-away
One accurate weight data point underwrites customs speed, trucking economy, crane efficiency, splice integrity, and crew safety. That’s why we spend the extra lab hours in Section 4—so every later milestone you own lands exactly where you budgeted it.

9. How Accurate Weight Data Lifts Our Sustainability Scorecard
9.1 Cutting Energy at the Source
Every kilogram we shave off a rubber conveyor belt means the drive motor pushes less mass. On our 5 km overland test line, a 12 kg / m reduction dropped annual electricity use by roughly 150 MWh. On a coal-heavy grid that equals about 110 t of CO₂ we no longer emit. Those savings flow straight into your Scope 2 ledger and our own ESG report—no spreadsheets full of assumptions, just smaller power bills and cleaner air.
9.2 Renewable Rubber and Closed-Loop Recycling
We already blend certified bio-based EPDM into selected cover compounds and track the renewable percentage by batch. Off-cuts, end-rolls, and used splice tails return to our reclaim plant in Nanjing, where the rubber becomes crumb for floor mats and traffic cones. Last fiscal year we diverted 2 400 t of material from landfill—enough to fill twenty 40-ft containers.
9.3 Giving Carcass Fibres a Second Life
Our cryogenic pulveriser cracks cured rubber off the aramid and UHMW-PE yarns we’re now using in light-weight designs. The clean fibres pelletise into injection-moulding feedstock, while the rubber crumb becomes binder for low-traffic paving. Because we log the exact mass of every outgoing and returning roll, ISO 14001 auditors sign off in a single visit, and you earn EPEAT credits faster.
9.4 Why Weight Accuracy Makes All the Numbers Credible
Carbon auditors, green-building certifiers, even marketing teams—the first thing they ask is, “How much material are we really talking about?” Our Section 4 workflow nails rubber conveyor belt weight within one percent, so when we say “12 % lighter” or “110 t less CO₂,” the numbers stand up to third-party scrutiny. No retro-calculations, no back-dating, just data that clears the review table the first time.
Our promise: precision in kilograms today becomes confidence in kilowatt-hours, carbon credits, and recycling metrics tomorrow. When you specify our lighter, reclaim-ready rubber conveyor belt, you get energy savings now and an easier environmental sign-off at end of life.