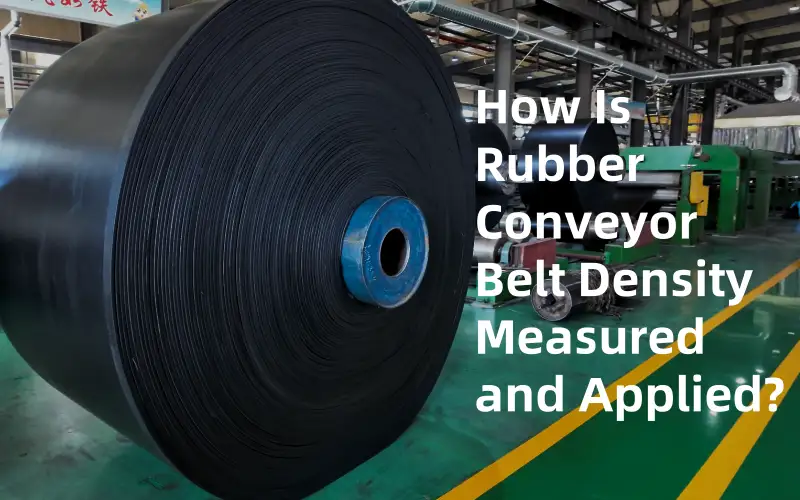
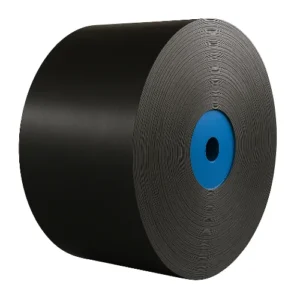
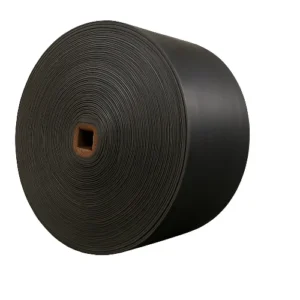
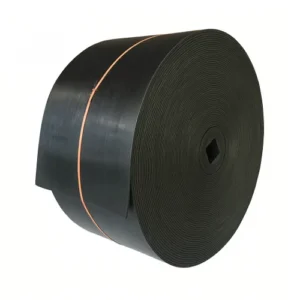
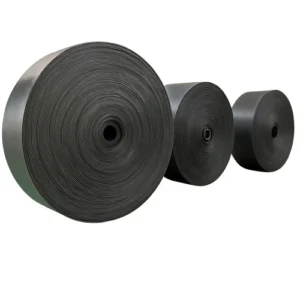
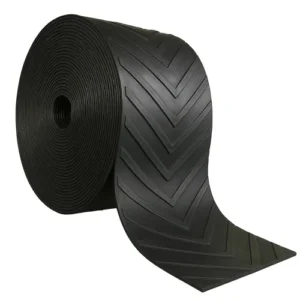
Rubber conveyor belt density, typically 1.10–1.35 g/cm³ for compounds and higher for full belts, is more than a number. This guide explains ISO 2781 test methods, how fillers and processing change density, and why it impacts belt weight, energy use, and long-term performance in mining, ports, and cement plants.
1. Scope and Definitions
In rubber engineering, Rubber conveyor belt density refers to two key measurements: compound density and apparent density. Compound density focuses on the rubber conveyor belt material itself—typically the cover or skim rubber—while apparent density includes reinforcements like textile or steel cords.
The standard unit is g/cm³, interchangeable with kg/m³ (1 g/cm³ = 1000 kg/m³). Often confused, specific gravity is dimensionless and equals the material’s density divided by 1000. For example, a compound with 1.23 g/cm³ has a specific gravity of 1.23.
Unless otherwise noted, test conditions follow 23 °C / 50% RH, per ISO 2781.
Rubber conveyor belt density is material- and structure-specific. Cover rubber density helps infer abrasion resistance and formulation consistency. Apparent density, however, reflects the entire belt—including fabric or steel reinforcement—and is more variable. Engineers often convert it into mass per square meter (kg/m²) or mass per linear meter (kg/m) for practical calculations.
Clarity in definition is essential. The property measured must match the performance indicator intended.

2. What Are You Measuring? Different Layers, Different Densities
Rubber conveyor belt density is not a single fixed value. It depends on what layer you’re testing—each component delivers a different number.
The cover rubber (top or bottom) is typically measured to evaluate abrasion resistance, filler content, or consistency of the rubber conveyor belt material. ISO 2781 is used to test this compound density. Results usually range from, depending on formulation and function.
Skim rubber—used between plies—has its own density profile and should be sampled separately for internal QC.
In contrast, the apparent density of the full belt includes carcass layers: fabric (EP, NN) or steel cords. This composite value is affected by both rubber content and reinforcement ratio. Since testing true volume is difficult, apparent density is often expressed as mass per meter (kg/m) or mass per square meter (kg/m²).

Bottom line: what you test is what you get. Be clear whether you’re analyzing a rubber compound or a full structural composite—because the implications for quality control, weight, and energy efficiency are entirely different.
Comparison Table
Layer | Typical Density Range | Test Standard | What It Reflects | Engineering Use |
Top Cover Rubber | 1.10–1.25 g/cm³ | ISO 2781 (A/B) | Rubber compound quality, abrasion resistance | Wear life estimation, formulation consistency |
Bottom Cover Rubber | 1.10–1.30 g/cm³ | ISO 2781 (A/B) | Similar to top cover, may differ in hardness | Dynamic resistance, impact absorption |
Skim Rubber (Interply) | 1.12–1.28 g/cm³ | ISO 2781 | Adhesion zone compound performance | Ply bonding, flexibility control |
Full Belt (EP carcass) | 1.30–1.55 g/cm³ (apparent) | Weight/Length calc | Composite mass: rubber + fabric layers | Energy modeling, drive power calculation |
Full Belt (Steel cord) | 1.60–2.10 g/cm³ (apparent) | Weight/Length calc | Steel density impact (7.85 g/cm³) significantly ↑ | Structural design, high-load applications |
3. What Affects Rubber Conveyor Belt Density in Real-World Compounds?
At Tiantie, we don’t just manufacture conveyor belts—we formulate them. That means every belt’s rubber conveyor belt density is a result of deliberate engineering, not coincidence.
Let’s look under the surface. A conveyor belt compound is more than just rubber. It’s a layered system built from:
3.1 Base Elastomers — The DNA of the Compound
The density of raw elastomers sets the tone:
- NR(~0.93 g/cm³): high resilience, excellent for dynamic loads.
- SBR(~0.94 g/cm³): abrasion-friendly, often used in DIN Y belts.
- NBR(~1.00 g/cm³): for oil-resistant applications—fertilizer, recycling.
- EPDM(~0.88–0.91 g/cm³): heat/weather resistant; often used in cement plants and metallurgy belts.
In Tiantie’s heat-resistant series (DIN T1/T2), we often use EPDM blends, but compensate for its low density with flame retardants—so base rubber isn’t the full story.

3.2 Fillers — Where Density Jumps
This is where real weight comes in. In our high-abrasion DIN X covers, carbon black loading can exceed 45 phr, pushing compound density to 1.24–1.30 g/cm³.
In MSHA-grade fire-resistant belts, ATH or magnesium hydroxide can exceed 60 phr, raising density to 1.35 g/cm³ and above—necessary for strict flame propagation control.
Key filler densities:
- Carbon black: 1.8–1.9 g/cm³
- ATH: ~2.4 g/cm³
- CaCO₃: ~2.7 g/cm³

3.3 Plasticizers and Processing Oils — Light, But Not Always Better
Used to reduce hardness or improve flexibility. For example, in NN belts running in low-tension conveyors in Southeast Asia, we may increase oil content to improve cold-start flexibility. But every 5 phr of oil can reduce density by ~0.01–0.015 g/cm³, while possibly compromising wear or aging.

3.4 Additives — Small in Amount, Big in Impact
Tiantie’s compounds often include custom blends of curatives and antioxidants. Their density impact is minor, but they control long-term behavior—aging, ozone resistance, ignition delay.

3.5 Putting It Together
Here’s the twist: Two compounds may both show a rubber conveyor belt density of 1.25 g/cm³, but behave entirely differently.
In one, it’s due to carbon black—a wear-focused belt for stone crushers.
In another, it’s ATH + EPDM—a fire-safe belt for a coal terminal.
In practice, density isn’t the answer—it’s the question. What was the compound optimized for? Weight, resistance, energy saving, or certification?
That’s why, in our R&D lab, density is never judged alone. It’s always paired with hardness, tensile strength, abrasion loss, and aging performance. Because numbers only matter when you understand what built them.
4. Rule of Mixtures: How Rubber Conveyor Belt Density Is Calculated
In the lab, rubber conveyor belt density can be measured. But in formulation, it’s predicted—down to two decimal points. At Tiantie, we use a classic engineering model to estimate compound density before we even mix a gram of rubber: the Rule of Mixtures.
This model assumes the compound’s total density is the weighted average of its ingredients, based on mass fraction and individual material density:
Rubber Compound Density Formula:
ρcompound = 1 / ∑i ( wi / ρi )
Where:
- wi= weight fraction of component i
- ρi = density of component i(in g/cm³ or kg/m³)
- ρcompound= predicted compound density
4.1 Practical Example from Tiantie’s Lab:
Target: DIN X cover rubber for heavy-duty mining
Formulation snapshot:
- NR/SBR blend: 40 phr (ρ ≈ 0.94)
- Carbon black (N330): 45 phr (ρ ≈ 1.85)
- Process oil: 8 phr (ρ ≈ 0.90)
- Curatives and others: 7 phr (ρ ≈ 1.60)
Total phr: 100
Let’s simplify:
This aligns with our actual measured density for Tiantie’s DIN X products (typically 1.23–1.26 g/cm³). Engineers then cross-check this predicted value with real test data from ISO 2781 Method A.
4.2 Why This Matters in Engineering
- If predicted density is too low, it may suggest excessive oil—triggering concerns on heat aging or tensile loss.
- If too high, it could point to overfilled FR additives—hurting elasticity or elongation at break.
- For every 05 g/cm³density increase, a 1-meter belt of 1.2 m width and 10 mm top cover adds ~0.6 kg to total mass—directly impacting power and tension design.
At Tiantie, we use this model not just to predict density, but to control consistency batch to batch, support cost-performance balancing, and even forecast energy consumption in client applications.

5. How Processing Alters Effective Rubber Conveyor Belt Density
A compound’s density isn’t locked in when it leaves the formulation table—it continues evolving during processing. This is a detail many overlook, but in practice, it’s often the reason for discrepancies between calculated and measured rubber conveyor belt density.
At Tiantie, we monitor this evolution closely—because the way a compound is shaped, cured, and assembled can shift its effective density by several percent.
5.1 Calendering: Not Just About Thickness
In high-volume runs, calendering pressure, roll temperature, and gap width control more than just dimensional accuracy—they directly influence porosity in the rubber sheet.
A low-pressure pass may leave micro-voids within the compound. These air gaps aren’t visible, but they reduce apparent density and long-term mechanical stability. We’ve measured up to 0.03 g/cm³ variation in density just by adjusting calender nip force by ±10%.
This is why all our calender lines—especially those used for high-abrasion and heat-resistant belts—are equipped with pressure-feedback loops. Without process control, material properties drift, even with a perfect formulation.

5.2 Vulcanization: Where Structure Locks In
Curing does more than set the rubber’s elasticity. It locks in volume. As crosslinks form, polymers pull slightly together, and any residual volatiles are expelled.
In controlled conditions, this shrinkage is small—around 0.5–1.2% in volume—but it’s enough to raise density by 0.01–0.02 g/cm³. Poor temperature uniformity, however, creates uneven crosslinking. One side of the belt may become denser and harder, while the other remains undercured.
We’ve invested in precision vulcanization monitoring across our 20+ lines, including real-time temperature mapping and pressure distribution analysis.

5.3 Reinforcement and Moisture Behavior
Belts built with NN fabric (nylon/nylon) often pick up ambient moisture—especially in high-humidity ports or tropical regions. That moisture increases mass but doesn’t change volume, which lowers measured density if you’re not adjusting for water gain.
In contrast, EP fabric (polyester/nylon) absorbs less water, typically only 30–40% of what NN absorbs under the same conditions. That’s why, for export belts heading to Southeast Asia or West Africa, we recommend EP carcasses where dimensional stability and weight precision matter.

5.4 Aging, Swelling, and Service Conditions
The job’s not done after production. Once installed, real-world conditions can further distort belt density:
- In oil-rich environments, NBR compounds can swell by 5–8% in volume, causing a drop of 0.03–0.06 g/cm³in density—even as the belt gets heavier.
- Under extreme heat, plasticizers and low-MW oils may volatilize, slightly lowering mass. This often shows up as a density dip of ~0.01 g/cm³during aging tests.
Our QA lab routinely simulates these scenarios—using ISO 1817 immersion protocols and custom-designed aging chambers—to ensure our belts hold up under both mechanical and chemical stress.

5.5 A Measured Result Is Never Just a Number
Two belts may look identical. Same formula, same color, same weight on the pallet. But if one came through a high-pressure calender and a well-calibrated vulcanization line, and the other didn’t—their densities (and performance) will diverge.
At Tiantie, we don’t just record density. We trace how it came to be—from roll settings to moisture levels to heat soak duration. Because every gram of precision starts with a gram of understanding.
6. Standard Test Methods and Sampling for Rubber Conveyor Belt Density
Accurate measurement of rubber conveyor belt density isn’t just about putting a sample on a scale—it’s about understanding which method you’re using, why it matters, and how to avoid misleading results.
At Tiantie, we follow international standards like ISO 2781 to ensure consistency across labs, clients, and production lines.
6.1 ISO 2781: The Global Benchmark for Rubber Density
This standard outlines two main methods for testing rubber compound density (excluding reinforcement fabrics or steel cords):
Method A — Liquid Displacement
- Uses distilled water or ethanol to determine volume based on displacement.
- Most accurate when the sample has a smooth, sealed surface.
- Density is calculated by:
Tiantie uses this method for final QA on cover rubber (top and bottom).
Method B — Hydrostatic Weighing (Archimedes Principle)
- Measures weight in air and weight submerged in liquid.
- Suitable for quick lab validation or production checks.
- Slightly more prone to error if air bubbles or rough edges are present.
6.2 Sampling: Where Many Get It Wrong
- Avoid fabric layers: Always sample from cover rubber only—free of textiles, cords, or bonding layers.
- Cut clean edges: Irregular shapes introduce error by trapping air.
- Condition samples: Per ISO 23529, standardize test temperature (commonly 23 °C ±2 °C) and humidity (~50% RH) before testing.
Even small surface defects—like flashing or porosity—can cause ±0.01–0.02 g/cm³ error. At Tiantie, we use rotary die-cutting and edge polishing to ensure repeatable results.
6.3 What Goes on the Report?
A full density test report includes:
- Method used (A or B)
- Liquid type and temperature
- Sample conditioning method
- Number of test replicates
- Mean density ± standard deviation
For example:
“ρ = 1.24 g/cm³ at 23 °C, ISO 2781 Method A, n=3, SD=0.01”
This isn’t just good lab hygiene—it’s what builds trust in cross-border B2B projects where your customer may be verifying results independently.
These are the simplest test methods, but at Tiantie we have more professional equipment to test the density and other parameters of the product.
6.4 At Tiantie, Testing Isn’t Just a Checkmark
Our lab doesn’t just test to meet requirements—we use density as a cross-verification tool. If compound density shifts unexpectedly, we immediately trace back: Was the oil loading higher? Was the batch mixed longer? Did moisture ingress occur?
A number means nothing without context. But with context, rubber conveyor belt density becomes a diagnostic tool—one we use every day.

7. From Density to Belt Weight — Engineering Conversions That Matter
Measuring rubber conveyor belt density is only the starting point. To make the number meaningful, engineers and buyers need to translate it into something tangible—kilograms per meter, total belt mass, or even energy consumption impact. At Tiantie, we use these conversions daily, both for internal QC and to help clients plan installations with precision.
7.1 Calculating Cover Rubber Weight
Here’s a practical example:
- Compound density ρ=1.20 g/cm³
- Belt width b=1.0 m
- Thickness t=10mm=0.01m
The formula for calculating the mass of rubber cover per meter is:
Wcover,1m=ρ⋅b⋅t=1200⋅1.0⋅0.01=12kg/m
This number gives you the linear mass of just the cover layer, not the entire belt.
7.2 Estimating Total Belt Mass
To get the actual belt weight, you’ll need to add all major layers:
- Top and bottom covers
- Skim rubber between fabric layers
- Carcass (fabric or steel)
For example, a 4-ply EP belt with 8 mm top and 4 mm bottom covers, 1.2 m wide, might result in:
Component | Weight (kg/m) |
Top cover (8 mm) | 9.6 |
Bottom cover (4 mm) | 4.8 |
Skim rubber | 2.4 |
EP carcass (4-ply) | 7.8 |
Total | 24.6 |
These numbers are not academic—they directly affect motor sizing, structural loads, and shipping costs.
7.3 Why Density Matters in Weight Planning
Let’s say your compound density rises from 1.18 to 1.22 g/cm³ due to a formula change. For a 1000-meter belt with 12 mm total rubber thickness, that small shift can add over 570 kg to the total belt mass.
More weight means more drive power, higher tension, and potentially higher energy consumption during operation.
7.4 Tiantie’s Approach
For large-scale projects like ports or cement lines with long inclined conveyors, we often optimize compound density without compromising durability. That could mean changing the filler mix or adjusting oil content to achieve lighter belts with stable performance. This kind of tuning is only possible when density data is tightly integrated into the engineering process.

8. Tolerance, Error Sources, and Risk Control in Rubber Conveyor Belt Density
In industrial practice, rubber conveyor belt density is often treated as a fingerprint of compound quality. But without context, it can be misread. A drop of 0.03 g/cm³ doesn’t necessarily mean the formulation has been diluted—and assuming so can lead to false accusations or overcorrection.
At Tiantie, we treat density as a diagnostic indicator, not a verdict. Here’s how we define acceptable variation, trace root causes, and communicate clearly with clients.
8.1 Common Sources of Measurement Error
Even with standardized testing (e.g. ISO 2781), the following factors can cause legitimate fluctuations:
- Air pockets inside the compound due to insufficient calendering pressure
- Surface defects or edge voids on test samples
- Contamination from fabric threads, talc, or mold release
- Swelling during service in oil or chemical environments
- Moisture absorption, especially in belts with NN carcasses
- Unstable test conditions, such as incorrect water temperature or weighing delay
In our experience, these variables can shift measured density by ±0.01 to ±0.02 g/cm³, even within spec.
8.2 What We Consider “Normal” at Tiantie
For in-plant compound checks, we define acceptable ranges as:
- ±0.02–0.03 g/cm³ for cover rubber
- Alongside parallel tracking of:
- Hardness (Shore A)
- Tensile strength and elongation
- DIN abrasion (volume loss)
These values form a “cluster signature.” A slight density drop, if not accompanied by a shift in abrasion or hardness, is unlikely to reflect material compromise.

8.3 Interpreting Deviations: Correlation Over Panic
We encourage a structured analysis when density moves outside trend:
Observation | Likely Cause |
Density trending higher | Elevated filler or flame retardant content |
Density trending lower | Extra oil, poor compaction, or swelling |
Inconsistent readings | Sample moisture or test handling variation |
The real question is not “why is the number different,” but “does this number correlate with actual performance?”
8.4 Density ≠ Proof of Under-Compounding
This is a key message we share with our global clients: Density is a flag—not a conclusion.
We’ve seen belts with 1.26 g/cm³ outperform those at 1.32. We’ve also seen cases where visual similarities masked real formulation shifts. That’s why we never judge by density alone—we compare it with mechanical data, curing profiles, and process logs.
At Tiantie, this triangulation is part of every batch review. It’s what allows us to distinguish between real formulation errors and minor fluctuations due to sampling, test setup, or atmospheric conditions.
9. Rubber Conveyor Belt Density vs. Performance — Correlation, Not Causation
It’s tempting to use rubber conveyor belt density as a shortcut for performance prediction. After all, a heavier compound feels tougher, right? But the relationship is more subtle.
At Tiantie, we treat density as a compound fingerprint—not as a performance guarantee. It correlates with other properties, but rarely explains them alone.
9.1 Abrasion Resistance — Often but Not Always Aligned
Higher density frequently reflects a higher loading of hard fillers such as carbon black or ATH. These ingredients improve wear resistance—up to a point.
For example:
- A belt with 26 g/cm³compound might score 90 mm³ volume loss on the DIN abrasion test.
- Another with 18 g/cm³could score 130 mm³, even with identical hardness.
But this correlation breaks down with extreme loading: excess filler may raise density but reduce tear strength or flexibility. That’s why Tiantie balances density against both DIN abrasion and tear propagation to avoid brittle behavior in dynamic systems.
9.2 Flexibility and Troughability
Lower-density compounds, especially those with higher oil content or soft polymers, typically offer better flexibility. This benefits:
- Short pulley diameters
- Steep incline conveying
- Cold weather performance
However, if density is low due to plasticizer overuse, it may hurt rebound resilience or thermal stability. That’s why our flexible belts still meet heat and oil resistance benchmarks, even at 1.15–1.18 g/cm³.
9.3 Power Consumption and Dynamic Load
Heavier belts require more drive force. In long-distance or high-speed systems, just a 0.03 g/cm³ shift in compound density can translate into:
- Higher start-up torque
- Increased running current
- Elevated motor temperature over time
When Tiantie engineers design belts for ports, mines, or cement lines, we run mass-per-meter simulations during the R&D phase to balance durability with energy efficiency.
9.4 Density as a Design Parameter, Not a Judgment
In real-world use, we’ve seen:
- Low-density beltsoutperform heavier ones in tear resistance, thanks to optimized polymers
- Mid-density beltswith poor abrasion values due to soft fillers
- High-density beltsfail early due to internal stress buildup during curing
So, while rubber conveyor belt density is always measured, it’s never used in isolation at Tiantie. It’s part of a cluster: we always consider hardness, tensile strength, DIN abrasion, rebound, elongation at break, and environmental compatibility.
Density is the start of a conversation—not the conclusion.

10. How Conveyor Belt Carcass Affects Apparent Density and Belt Weight
When calculating the total weight of a rubber conveyor belt, it’s easy to focus solely on the compound density. But the real-world belt is a multi-layered system. The carcass structure—whether EP, NN, or steel cord—not only contributes significantly to total mass per meter but also alters how the belt behaves in storage, transport, and operation.
That’s why engineers working with long conveyor runs or incline belts need to look beyond rubber and account for apparent density—the result of both compound and carcass.
10.1 Fabric Carcass (EP vs. NN): Not All Plies Are Equal
Most textile-reinforced belts use either EP (Polyester/Nylon) or NN (Nylon/Nylon) fabric. While both offer good strength, their mass and moisture behavior differ.
Parameter | EP Fabric | NN Fabric |
Dry weight per ply (g/m²) | ~260–280 | ~280–310 |
Water absorption tendency | Low (≤0.2%) | Higher (2–4%) |
Dimensional stability | High | Moderate |
In practical terms: a 4-ply NN belt may gain up to 1.2 kg/m over its dry weight in high humidity. That increase won’t show up in lab density tests—but it shows up on the scale and in the drive motor load.

10.2 Steel Cord Belts: High Mass, High Tension
Steel cord (ST) belts tell a different story altogether. Steel’s density is 7.85 g/cm³, far beyond any rubber compound.
For example, a standard ST1000 belt with 12 mm top and 8 mm bottom cover might weigh over 35 kg/m, nearly 50% heavier than an equivalent EP belt. That affects:
- Required tensioning system
- Drive motor sizing
- Pulley design and shaft life
- Belt reel handling and storage limits
In some export shipments, we’ve even had to re-calculate packaging specs to account for cord weight variations between markets.

10.3 Apparent Density Is a Design Parameter, Not a QC Metric
It’s important to separate compound density, which is tightly controlled and reported (per ISO 2781), from apparent belt weight, which varies by construction.
When a user reports “the belt seems heavier than expected,” the root cause is often not a change in formulation—but a difference in carcass design, fabric weight, or absorbed moisture.
That’s why our product specs always include both:
- Cover rubber density(g/cm³)
- Unit belt mass(kg/m)
The first supports quality control; the second supports engineering. They serve different purposes—but both matter when you’re working with 800-meter incline belts or high-load transfer points.
11. How Density Becomes a Practical Tool in Rubber Conveyor Belt Quality Control
In production, we don’t measure rubber conveyor belt density just because a standard says so—we measure it because it reveals patterns. A small drift in density, repeated over time, often signals a shift in formulation, mixing uniformity, or even calender settings.
Across large-scale facilities like ours, where thousands of meters are produced daily, using density as a real-time diagnostic metric helps catch issues early—before they show up as field failures or claims.
11.1 Incoming Material and Batch Tracking
Every batch of rubber compound is logged with a unique ID and tested for:
- Density at 23°C (ISO 2781, Method A)
- Shore A hardness
- Mooney viscosity
When these values drift beyond internal thresholds (e.g., ±0.02 g/cm³ from batch average), it triggers a formulation audit. In practice, we’ve traced subtle density shifts back to:
- Carbon black batch variation
- Oil dosing drift from auto-feeding units
- Slight over-curing in the mixing stage
![]()
11.2 Calender and Curing Consistency
During sheet calendering and final belt vulcanization, density helps us validate that:
- Rubber was compacted with proper nip pressure
- Moisture or volatile loss during curing didn’t alter mass
- Layer thickness correlates with expected mass-per-meter
We compare measured sheet density × thickness × width against real belt weight. A deviation of >0.5 kg/m² flags a production variance.

11.3 Final Inspection and COA Reporting
Before shipment, belts undergo random density checks from sampled cover rubber:
- Samples are taken at full width
- Edges are trimmed and polished to avoid voids
- Water displacement method (Method A) is used unless otherwise required
Each Certificate of Analysis (COA) includes:
- Cover Compound Density: 1.22 g/cm³
- Method: ISO 2781-A
- Test Temp: 23°C
- Deviation vs Spec: +0.01
- Result: PASS
Some clients—especially in OEM supply—require per-roll density checks for incoming QC traceability. That’s why we include lot-based density mapping for those orders.
11.4 Density + Hardness + Abrasion = Control Triangle
One number is never enough. We always cross-check:
- Density(bulk formulation consistency)
- Hardness(cure level and filler profile)
- DIN abrasion(performance proxy)
If one parameter shifts, but the others remain stable, it might be an external variation (e.g., moisture or sampling). But when two or more move in sync, that’s a red flag.
This 3-point model is part of every shift report and monthly QA trend review.
12. Practical Appendix for Rubber Conveyor Belt Density Analysis
Below is a set of ready-to-use technical references that support density-related calculations, communication, and on-site checks.
📌 1. Water Density vs. Temperature Table
Used in ISO 2781 Method A (displacement method). Essential for accurate density conversion during testing.
| Temperature (°C) | Water Density (g/cm³) |
| 20 | 0.9982 |
| 23 (default) | 0.9975 |
| 25 | 0.9970 |
| 30 | 0.9957 |
If your lab is not climate-controlled, use this to correct liquid density during calculation.
📌 2. Common Filler and Additive Densities
These values are used when estimating compound density from formulation (see Rule of Mixtures).
| Material | Density (g/cm³) |
| Carbon black | 1.8–1.9 |
| White silica | 2.0–2.6 |
| Calcium carbonate (CaCO₃) | 2.7 |
| Aluminum hydroxide (ATH) | ~2.4 |
| Paraffinic process oil | 0.85–0.90 |
| Aromatic process oil | 0.92–0.95 |
📌 3. Compound Density Estimation Formula
To estimate compound density based on ingredient mass ratio:
Ρcompound = 1 / ∑(wi / ρi)
Where:
- Ρcompound= overall compound density (g/cm³)
- Wi= mass fraction of each ingredient (∑wi= 1)
- Ρi= individual ingredient density (g/cm³)
This equation assumes full mixing and no porosity—ideal for lab compound design or QC simulation.
📌 4. Cover Rubber Weight Calculator (per meter)
You can estimate the weight of one meter of cover rubber using:
Wcover (kg/m) = ρ × b × t
Where:
- ρ = compound density in kg/m³
- b = belt width in meters
- t = cover thickness in meters
Example:
If ρ = 1200 kg/m³, width = 1.2 m, cover thickness = 10 mm (0.01 m):
Wcover = 1200 × 1.2 × 0.01 = 14.4 kg/m
This is especially useful when comparing lightweight vs. heavy-duty designs during the quoting phase.
📌 5. Reference Belt Mass Ranges (EP & ST)
| Belt Type | Total Weight (kg/m) | Notes |
| EP 200/2, 4+2 mm | ~13–15 | General purpose |
| EP 300/4, 6+3 mm | ~20–22 | Heavy-duty abrasion belt |
| ST1000, 12+8 mm | ~35–38 | Steel cord mining applications |
| EP vs. NN (same ply) | NN often +0.5–1.5 | Due to higher fabric GSM and water uptake |
13.FAQ
Q1. What’s the most reliable way to measure rubber conveyor belt density on site?
A: The most practical method is the displacement method (ISO 2781, Method A), using distilled water and a precision scale. It requires trimming the sample to remove edge voids and measuring at 23°C to reduce temperature-induced error.
If quick field checks are needed, a simplified Archimedes method using tap water and a digital balance can be used—just correct for water density at ambient temperature.
But note:
- Always avoid cloth-reinforced sections—fabric absorbs water, skewing results.
- Perform at least 3 repetitions, and report both average and standard deviation.
- For legal or claim purposes, lab testing under controlled conditions is mandatory.
We recommend using density as a trend indicator, not a single pass/fail criterion.
Q2. Why does my lab density result differ from field-measured belt weight?
A: Lab tests focus on cover compound density, while belt weight includes carcass mass, absorbed moisture, and possible environmental exposure. For example, a belt stored in 90% humidity may gain 1–2% in mass due to fabric moisture. Always distinguish compound density from apparent belt density.
Q3. Why are flame-retardant or oil-resistant belts heavier?
A: These compounds require higher filler loadings—e.g., ATH for flame retardancy or NBR with high plasticizer for oil resistance. Fillers like ATH (2.4 g/cm³) and CaCO₃ (2.7 g/cm³) increase total mass. Even if hardness stays constant, density and per-meter weight will rise.
Q4. What’s a normal density tolerance for quality control?
A: For cover rubber, internal QC often sets ±0.02–0.03 g/cm³ as the acceptance range. This ensures formulation consistency without overreacting to sampling or method variation. Still, density must always be cross-checked with hardness and abrasion data for a reliable evaluation.
Q5. Can density alone prove if a belt is underfilled or degraded?
A: No. Density is a useful indicator, but not conclusive alone. A drop in density could be due to higher oil content, aeration, under-curing, or even sampling near an air pocket. To detect underfilling or material shortcuts, combine density data with volume loss (DIN abrasion), hardness, tensile strength, and X-ray if needed.

